
[FINAL] How to Use Excel for Small Business | Functions, Tips & Tricks

For small business owners, the thought of delving into complex data management and financial analysis can feel like a lot of time and effort. But fear not! From bookkeeping and customer management to AASB-compliant financial reporting, Excel is a powerful software that can transform how you handle your business data. In this in-depth guide, we'll introduce you to the world of Excel to discover how you can streamline your business processes and take your decision-making to the next level!
.webp)
In the ever-evolving business landscape, Microsoft Excel has remained a constant, revered as a robust platform for data visualisation and analysis. Let's begin by understanding exactly what Excel is and how it can be a game-changer for your business.
What is Microsoft Excel?
At its core, Microsoft Excel is a key component of the Microsoft Office suite that utilises spreadsheets and an extensive array of formulas and functions to efficiently store, organise, and analyse data sets, making it a time-tested staple in various business sectors.

How Can Excel be Used for Business?
In the business realm, Excel is frequently employed to create detailed financial documents. Its strong computational abilities allow for automatically calculating sums, averages, and totals, making it a staple in accounting offices. However, Excel's utility spans a broader spectrum. It's an invaluable asset for crafting balance sheets, budgets, and editorial calendars, among other applications that can change the game for your small business.
Excel's appeal lies in its ability to simplify and expedite data management tasks. Whether you're managing an extensive business with numerous employees and partners or a sole trader just starting up and trying to get on top of your finances, this guide will explore the shortcuts and solutions Excel can offer to streamline your workflow.
Join us as we delve deeper into Excel's capabilities, providing you with the knowledge and tools to leverage this powerful software for your business's benefit!
Creating Business Documents with Excel
Excel's flexibility and powerful features make it an excellent tool for crafting a variety of business documents. Let's explore the types of documents you can create and how Excel can streamline these tasks for your business:
Crafting Financial Documents in Excel
Excel is a versatile tool for creating a range of essential financial documents, each serving a critical purpose in your business's financial management. Here are a few key documents Excel can help streamline the compilation of:
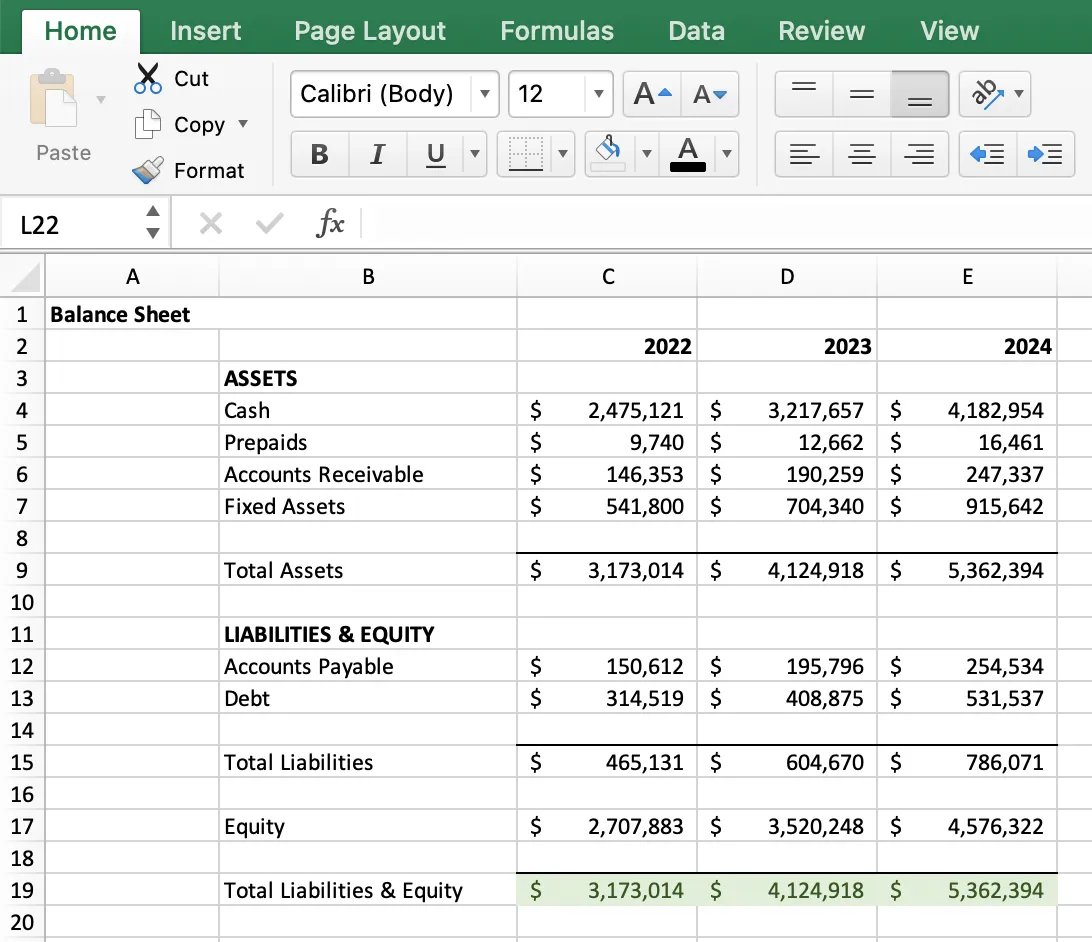
- Balance Sheets: Balance sheets are among the most common types of documents you can create with Excel. They allow you to get a holistic view of your business's financial standing at any given point, detailing assets, liabilities, and equity.
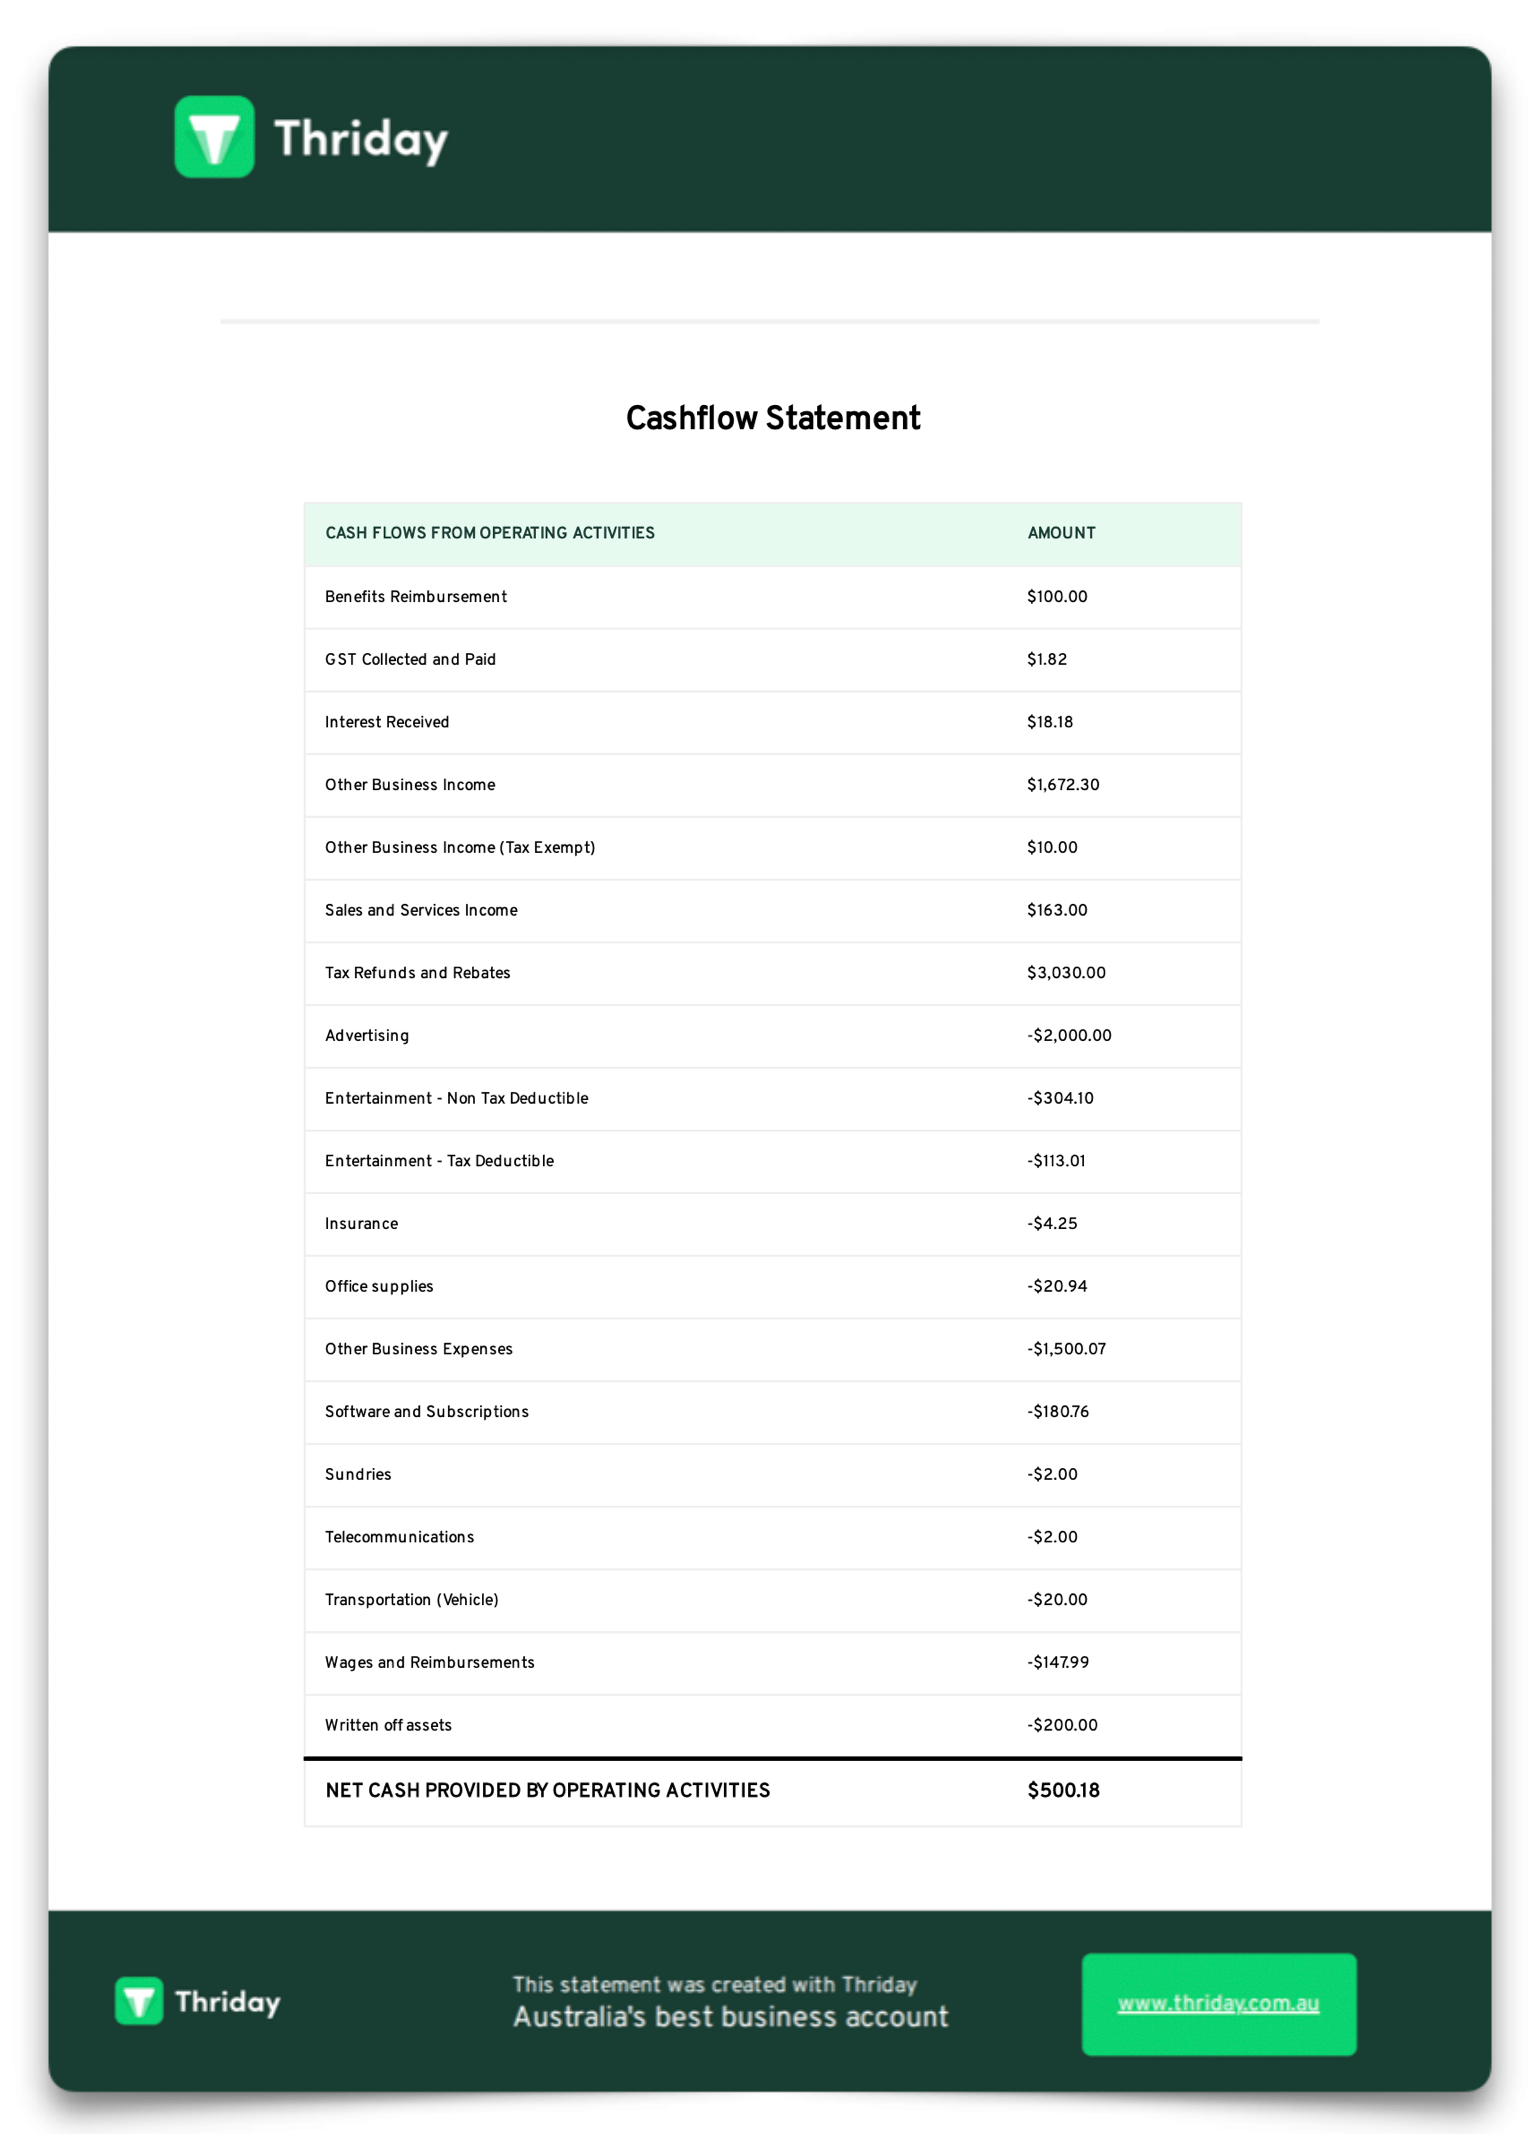
- Cash Flow Statements: Tracking the flow of cash in and out of your business is crucial, and Excel is an excellent tool for creating these statements, helping you understand your business's liquidity and financial health.
- Income Statements: Also known as profit and loss statements, these documents are pivotal for summarising your company's financial activities over a specific period.
- Budget Sheets: You can also use Excel to create detailed budget sheets for mapping out and monitoring your business's expenses and revenues, including projections and variance analysis, which are crucial for sound financial planning.
Generating Business Reports
Beyond financial documents, Excel is adept at generating various business reports, providing valuable insights into different aspects of your business operations. Create reports such as:
- Sales Reports: Excel can be your go-to tool for compiling comprehensive sales reports. It's great for tracking performance, analysing customer behaviour, and identifying market trends.
- Inventory Reports: Managing stock? Excel helps you create detailed inventory reports, keeping track of stock levels and aiding in inventory planning.
- Performance Dashboards: With advanced charting capabilities, you can use Excel to create visually appealing performance dashboards that provide a quick snapshot of key business metrics for performance monitoring.
Forecasting and Analysis
Excel is also a powerful ally in forecasting and analysis to make informed predictions and assessments about your business's future financial health. Examine and take control of your business' trajectory with:
- Revenue and Expense Forecasts: Use Excel to forecast future cash flow or revenue and expenses based on past data to help you plan your finances more accurately.
- Financial Analysis Sheets: Leverage Excel's analytical tools to create sheets for financial analysis, including ratio and trend analysis.
All of this still only scratches the surface of what can be done in Excel and its capabilities for use in small businesses. The extensive range of features provides endless possibilities for enhancing your business operations, from financial management to data analysis – it is truly an indispensable asset for business efficiency.
However, while the power and versatility of the software are well understood, it's also important to note that there are now next-generation accounting platforms that have revolutionised the way small businesses handle their finances further, offering more straightforward, integrated and automated approaches to financial management and saving small business owners a ton of time in the process!
Thriday: The All-in-One Automated Alternative to Excel for Small Business
While Excel offers robust capabilities for various elements of business analysis, Thriday emerges as a comprehensive, automated solution that eliminates the headache of tedious financial admin for small businesses looking to streamline their processes.
As a next-generation all-in-one financial management platform, Thriday simplifies and automates the process of tracking your business finances, offering a next-generation AI-driven solution to the traditional challenges posed by manual Excel management.
Thriday combines banking* and accounting into a single platform, seamlessly integrating all your financial data in one place and automating the creation of financial reports, forecasts, and analyses - tasks that have historically required extensive manual work by small business owners in Excel.
From expense categorisation to generating financial reports and forecasting, simply use your Thriday business bank accounts* as usual, and the platform handles the rest automatically with ease and precision. Full-scale integration ensures that all of your business's financial data is always up-to-date and accurate, providing you with real-time insights into your business's financial health without lifting a finger or spending any more nights unpacking Excel functions.
How Does Thriday Work?
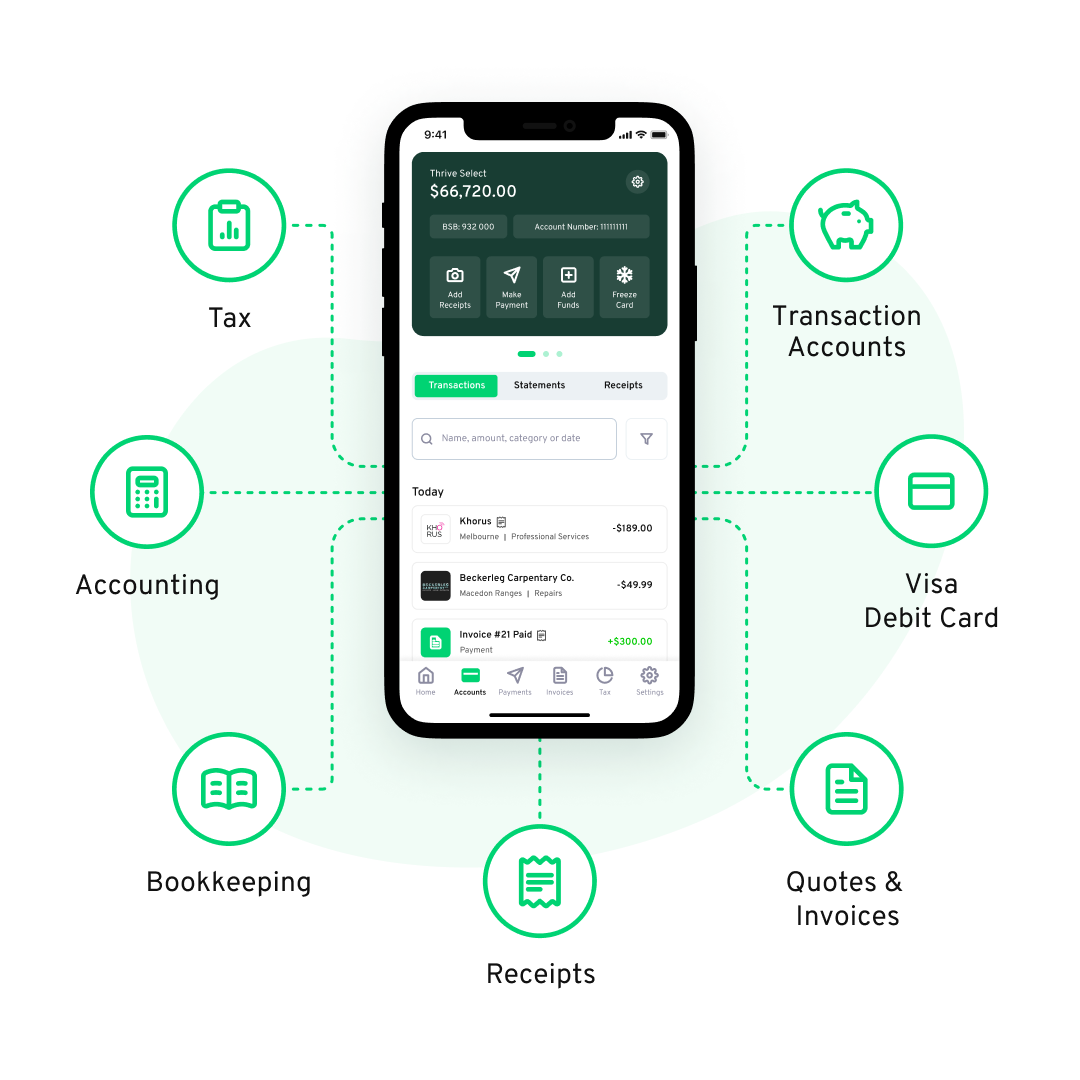
Thriday's platform is designed to be intuitive and user-friendly to eliminate financial admin for small business owners in Australia. Here's how Thriday works:
- Seamless Integration with Business Bank Accounts*: Thriday's user-friendly app has business bank accounts* built-in, meaning all your incoming or outgoing transactions are automatically synced and categorised with Thriday - reducing the risk of errors and saving the time associated with tedious manual data entry in Excel. Find out more about Tireless Transacting here.
- Automated Financial Reporting: With all your financial data in one place, Thriday automatically reconciles your transactions to easily generate all of your essential financial reports with the power of AI: income statements, balance sheets, cash flow statements, tax forecasts and more created, updated and maintained automatically in real-time as transactions happen to provide an accurate and comprehensive view of your business finances at any given moment. Discover the power of Automated Accounting here.
- Receipt Reconciliation: Simply take a photo of your receipts, and Thriday does the rest - automatically uploading, storing, and categorising them for personalised deductions; ensure your receipts are not only securely saved but also neatly organised and easily retrievable for tax purposes, making tax time relax time!
With Thriday, you can enjoy the benefits of a sophisticated financial management system without the complexities and time-consuming processes associated with Excel.

Find out how our happy customers have revolutionised their business finances with Thriday here!
Excel Basics for Business: Navigating Spreadsheet Essentials
Getting started with Excel opens up a world of possibilities for your business. Renowned for its versatility, the software is more than just a spreadsheet tool; it's a powerhouse for data management, calculations, and presentation.
We'll start by diving into the basics of using Excel for business, like sheet creation, formatting, auto-fill and sorting to give you a solid foundation to build from:
Creating and Customising Spreadsheets
Starting with Excel begins with creating a new spreadsheet. This blank canvas is where your data storytelling begins. Customising your spreadsheet is key – from adjusting column widths and changing font styles to adding colours to headers, these tweaks enhance readability and presentation. To create a new spreadsheet, simply open Excel and select 'New' to start.
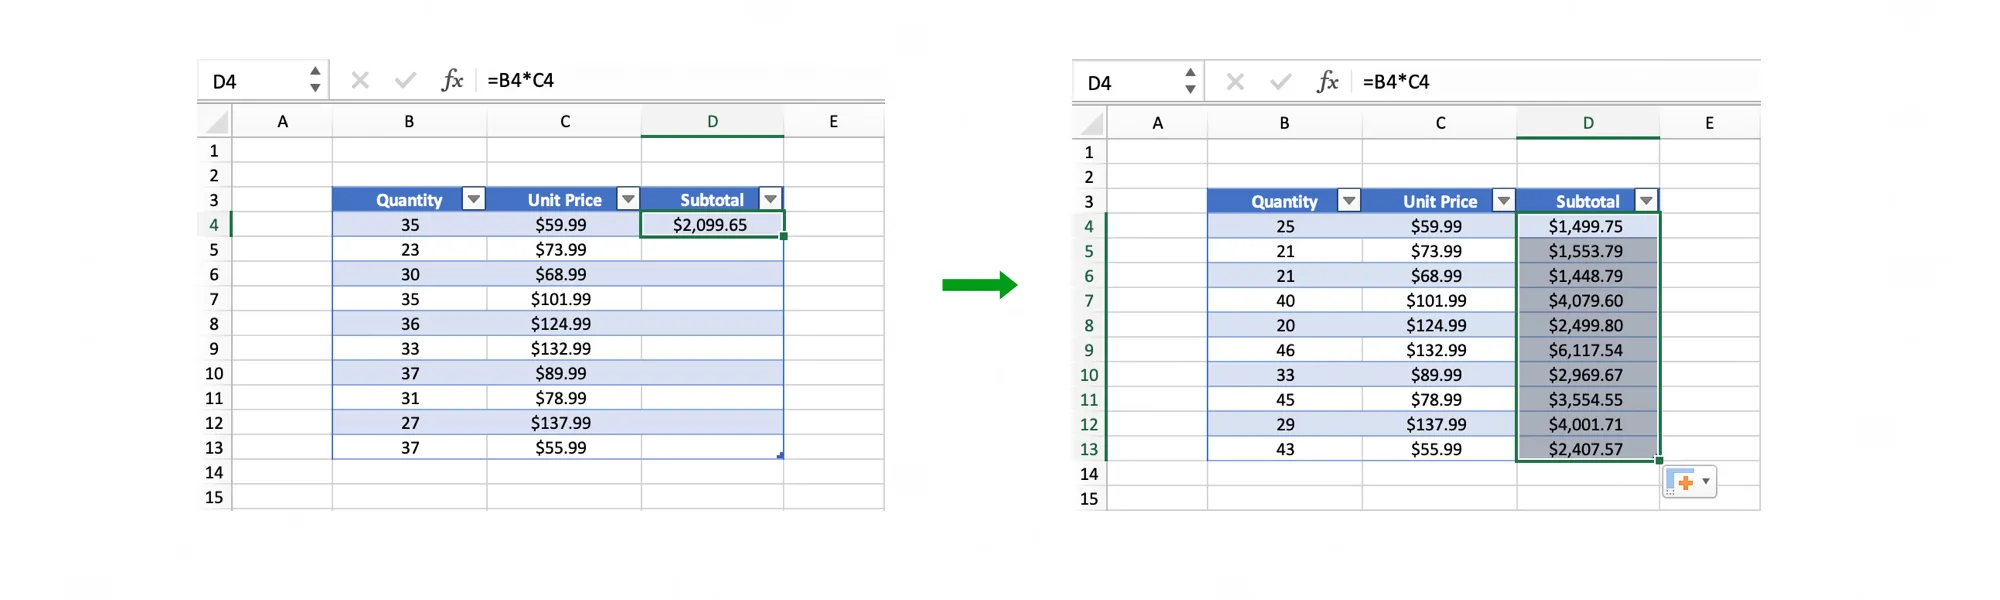
Auto-Fill: A Time-Saving Wonder
Auto-fill is a lifesaver for repetitive data entry. This nifty tool allows you to quickly replicate data across cells, saving you time and reducing the risk of errors. Whether you're extending a series of dates, copying formulas, or filling in repetitive text, auto-fill is your go-to feature for efficiency.
To use it, enter data in a cell, select the cell, and then drag the fill handle (a small square at the bottom-right corner of the cell) across other cells you want to fill. Excel will automatically replicate the data or pattern.
Sorting and Organising Your Data
With just a few clicks, you can arrange your data alphabetically, numerically, or even custom-sort based on your criteria. This feature is handy when dealing with large datasets, such as customer lists or product inventories, helping you find the information you need quickly and easily.
To sort data, select the column you want to sort, then go to the 'Data' tab and click 'Sort A to Z' or 'Sort Z to A'. This feature is invaluable for managing large datasets like customer lists or product inventories.
Freezing Panes for Easy Navigation
As your spreadsheet grows, keeping track of your headers can become challenging. Excel's freeze panes feature comes to the rescue, allowing you to keep your row and column titles visible as you scroll through your data. This simple yet effective tool ensures you never lose track of what each column or row represents, no matter how far down or across you scroll.
Freeze panes by selecting the row or column you want to keep visible, then go to the 'View' tab and click 'Freeze Panes'. This keeps your headers visible as you scroll, ensuring you always know what data you're viewing.
Now that you're equipped with the fundamental tools to navigate your sheet effectively - let's explore some more advanced features, formulas, and functions to take your data analysis and business decision-making processes to the next level!
Getting Started with Excel Formulas
Excel's array of formulas is a treasure trove for anyone looking to make sense of data, especially in a business context. While they might initially seem overwhelming, these formulas are indispensable tools for transforming raw data into meaningful insights. As a beginner in Excel, starting with these basic formulas will enable you to perform complex functions with ease, laying the groundwork for more advanced data manipulation:
- The Foundation - Equal Sign (=): Every journey into Excel formulas begins with an equal sign. This small yet crucial symbol signals to Excel that you're about to enter a formula. For example, if you're calculating a total or a result, you start by typing '=' in the cell where you want your answer to appear.
- Addition (+): To sum up values from different cells, use the plus sign. It's as simple as typing '=A5+B7' to add the values in cells A5 and B7. This basic operation is fundamental in tasks like totalling sales figures or combining budget items.
- Subtraction (-): The minus sign is your go-to for subtracting one cell's value from another. A formula like '=A5-B7' is handy for calculating the difference between two numbers, such as expenses subtracted from revenues.
- Multiplication (*): Use the asterisk to multiply cell values. A formula such as '=A5*B7' multiplies the contents of A5 and B7, which is useful in scenarios like calculating total cost from unit price and quantity.
- Division (/): The slash comes into play for division. Typing '=A5/B7' divides the value in A5 by B7, which can be used for operations like determining the average cost per item or the ratio of expenses to revenues.
- Combining Operations: Excel allows you to build more complex formulas by blending these basic operations. For instance, '=(A5-B7)/((D5+B6)*3)' is a combination of addition, subtraction, multiplication, and division, useful for intricate calculations like weighted averages or complex budget estimations.
Remember, for more intricate formulas, enclose parts of the formula in parentheses to control the order of operations, following the PEMDAS rule; this ensures that Excel performs calculations in the correct sequence, providing accurate results. You can also include direct numbers in your formulas for more flexibility."
Excel Functions for Business Efficiency
Moving on from basic formulas, Excel's functions take efficiency and accuracy in data management and analysis to the next level – letting you automate and streamline the tasks that would otherwise require more complex formulas.
For example, rather than calculating an average by manually adding up a range of cells and then dividing by the count of those cells, you can simply use the AVERAGE function; this is just one of the many ways Excel simplifies calculations and tasks in a business setting.
Let's explore some functions that are pivotal in automating business-related calculations and processes:
- SUM: The SUM function is a fundamental tool in Excel, designed to automatically add up a range of cells or numbers. It simplifies the process of totalling figures, which is a frequent need in business calculations, especially in preparing financial statements and budget sheets. For example, `=SUM(C5:C30)` quickly calculates the total of sales figures or expenses from C5 to C30.
- AVERAGE: The AVERAGE function is key for analysing data sets. It calculates the mean value of a specified range of cells, providing insights into trends and averages crucial in areas like sales performance analysis and employee productivity. For instance, `=AVERAGE(D5:D30)` computes the average sales figures in cells D5 through D30.
- IF: The IF function introduces conditional logic into Excel spreadsheets. It allows you to return specific values based on a predefined condition, making it invaluable for scenario analysis and decision-making in budgeting and financial forecasting. An example of its use is `=IF(B2>C2, "Profit", "Loss")`, which checks if the revenue in B2 exceeds the expenses in C2.
- VLOOKUP: VLOOKUP is a powerful function for searching through rows of data. It's particularly useful for finding specific information within large datasets, such as looking up product prices or customer information in sales and inventory management. For example, `=VLOOKUP("Product123", ProductTable, 3, FALSE)` can be used to search for the price of 'Product123' in a product table.
- INDEX: The INDEX function is about precision in retrieving data. It returns a value from a specific place within a range, based on the row and column numbers you specify. An example is # =INDEX(SalesData, 4, 2), which fetches the value from the fourth row and second column of the range named 'SalesData', which is useful in complex data sets like financial reports.
- MATCH: MATCH works well alongside INDEX. It finds the position of a specified item in a range, which can be used for various lookup operations in inventory management and project tracking. For example, `=MATCH("ProjectX", ProjectList, 0)` locates the position of "ProjectX" within the project list, which is helpful in tracking project timelines.
- COUNTIF: The COUNTIF function is all about counting cells that meet a certain criterion. It's a straightforward way to quantify occurrences of specific data within a range, such as counting the number of sales transactions exceeding a certain value or tracking the frequency of a specific issue in customer feedback. For instance, `=COUNTIF(SalesRegion, "North")` counts how many sales occurred in the 'North' region.
- SUMIF: SUMIF adds a conditional element to summing operations. It totals the values in a range that meet specified criteria, ideal for segmenting data in financial analysis, like summing sales only for a particular region or product category. An example of its application is `=SUMIF(SalesRegion, "East", SalesAmount)`, which sums the sales amounts where the corresponding region is 'East'.
- CONCATENATE: CONCATENATE is a text function that merges data from different cells - handy for combining pieces of information, like names or addresses, in customer databases or employee records. For example, `=CONCATENATE(A2, " ", B2)` combines the first name in A2 and the last name in B2 to create full names for customer contact lists.
These functions demonstrate Excel's power in handling a variety of business tasks, from basic calculations to complex data analysis. Whether you're managing finances, overseeing inventory, or analysing sales data, there's an endless list of Excel functions designed to make your job easier and more productive.
For small businesses seeking an even simpler and automated approach, Thriday provides an alternative, handling everything from banking* to bookkeeping and real-time financial insights, all without the intricacies of spreadsheet management.

With tools like Excel or even more innovative solutions like Thriday enhancing productivity and decision-making efficiency, you're well-equipped to navigate the complexities of the business world with confidence and skill.
Advanced Excel Tips and Tricks for Business
Understanding and Utilising Pivot Tables in Business
Pivot tables are one of Excel's most powerful features, especially for those in the business world who may not be familiar with their capabilities. Essentially, a pivot table is an advanced tool in Excel that allows you to quickly reorganise and summarise complex data sets. It's like having a data wizard at your fingertips, enabling you to extract significant insights from large, detailed datasets with minimal effort.
What Are Pivot Tables?
Imagine you have a spreadsheet filled with months of sales data - it includes dates, product names, regions, salespeople, and revenue figures. Navigating this data to find specific insights, like total sales per region or top-selling products, can be daunting. This is where pivot tables come in.
A pivot table takes this raw data and allows you to "pivot" or rotate it to view it from different perspectives. You can drag and drop fields into different parts of the pivot table to reorganise the data, helping you to:
- Summarise Data: Quickly calculate totals, averages, counts, and more. For example, you can sum up the total sales for each product category.
- Filter and Segment Data: Focus on specific subsets of your data. For instance, you might want to see sales figures for just one region or during a particular quarter.
- Compare and Contrast: Easily compare different data points. For example, you could compare the performance of salespeople across different regions.
How to Use Pivot Tables for Small Business?
Pivot tables are a versatile and powerful tool for anyone in the business sector looking to make more informed decisions based on their data. Here are a few of the many ways pivot tables can be leveraged to help you better understand and manage your small business:
- Sales and Revenue Analysis: Pivot tables can break down sales data by product, region, or sales team, helping businesses understand where their revenue is coming from.
- Inventory Management: They can help track inventory levels, categorise products based on sales velocity, and identify items that need to be reordered.
- Financial Reporting: Pivot tables are excellent for creating detailed financial reports, such as profit and loss statements, by summarising and categorising financial data.
- Customer Insights: Analyse customer data to segment customers, understand buying patterns, and tailor marketing strategies.
Practical Example: Enhancing Sales Data Analysis with Pivot Tables
Consider you're handling a large sales dataset in Excel, encompassing various products sold across multiple regions. The data includes sales transaction data, regions, and product types, among other fields. To efficiently analyse which products are performing best in each region, you decide to use a pivot table.
By creating a pivot table, you can set 'Region' as your row label and 'Product Type' as your column label, with 'Revenue’ as the value. This setup quickly provides a clear view of sales performance by product and region so that you can easily identify which products are top sellers in specific regions and which ones might need more marketing focus.
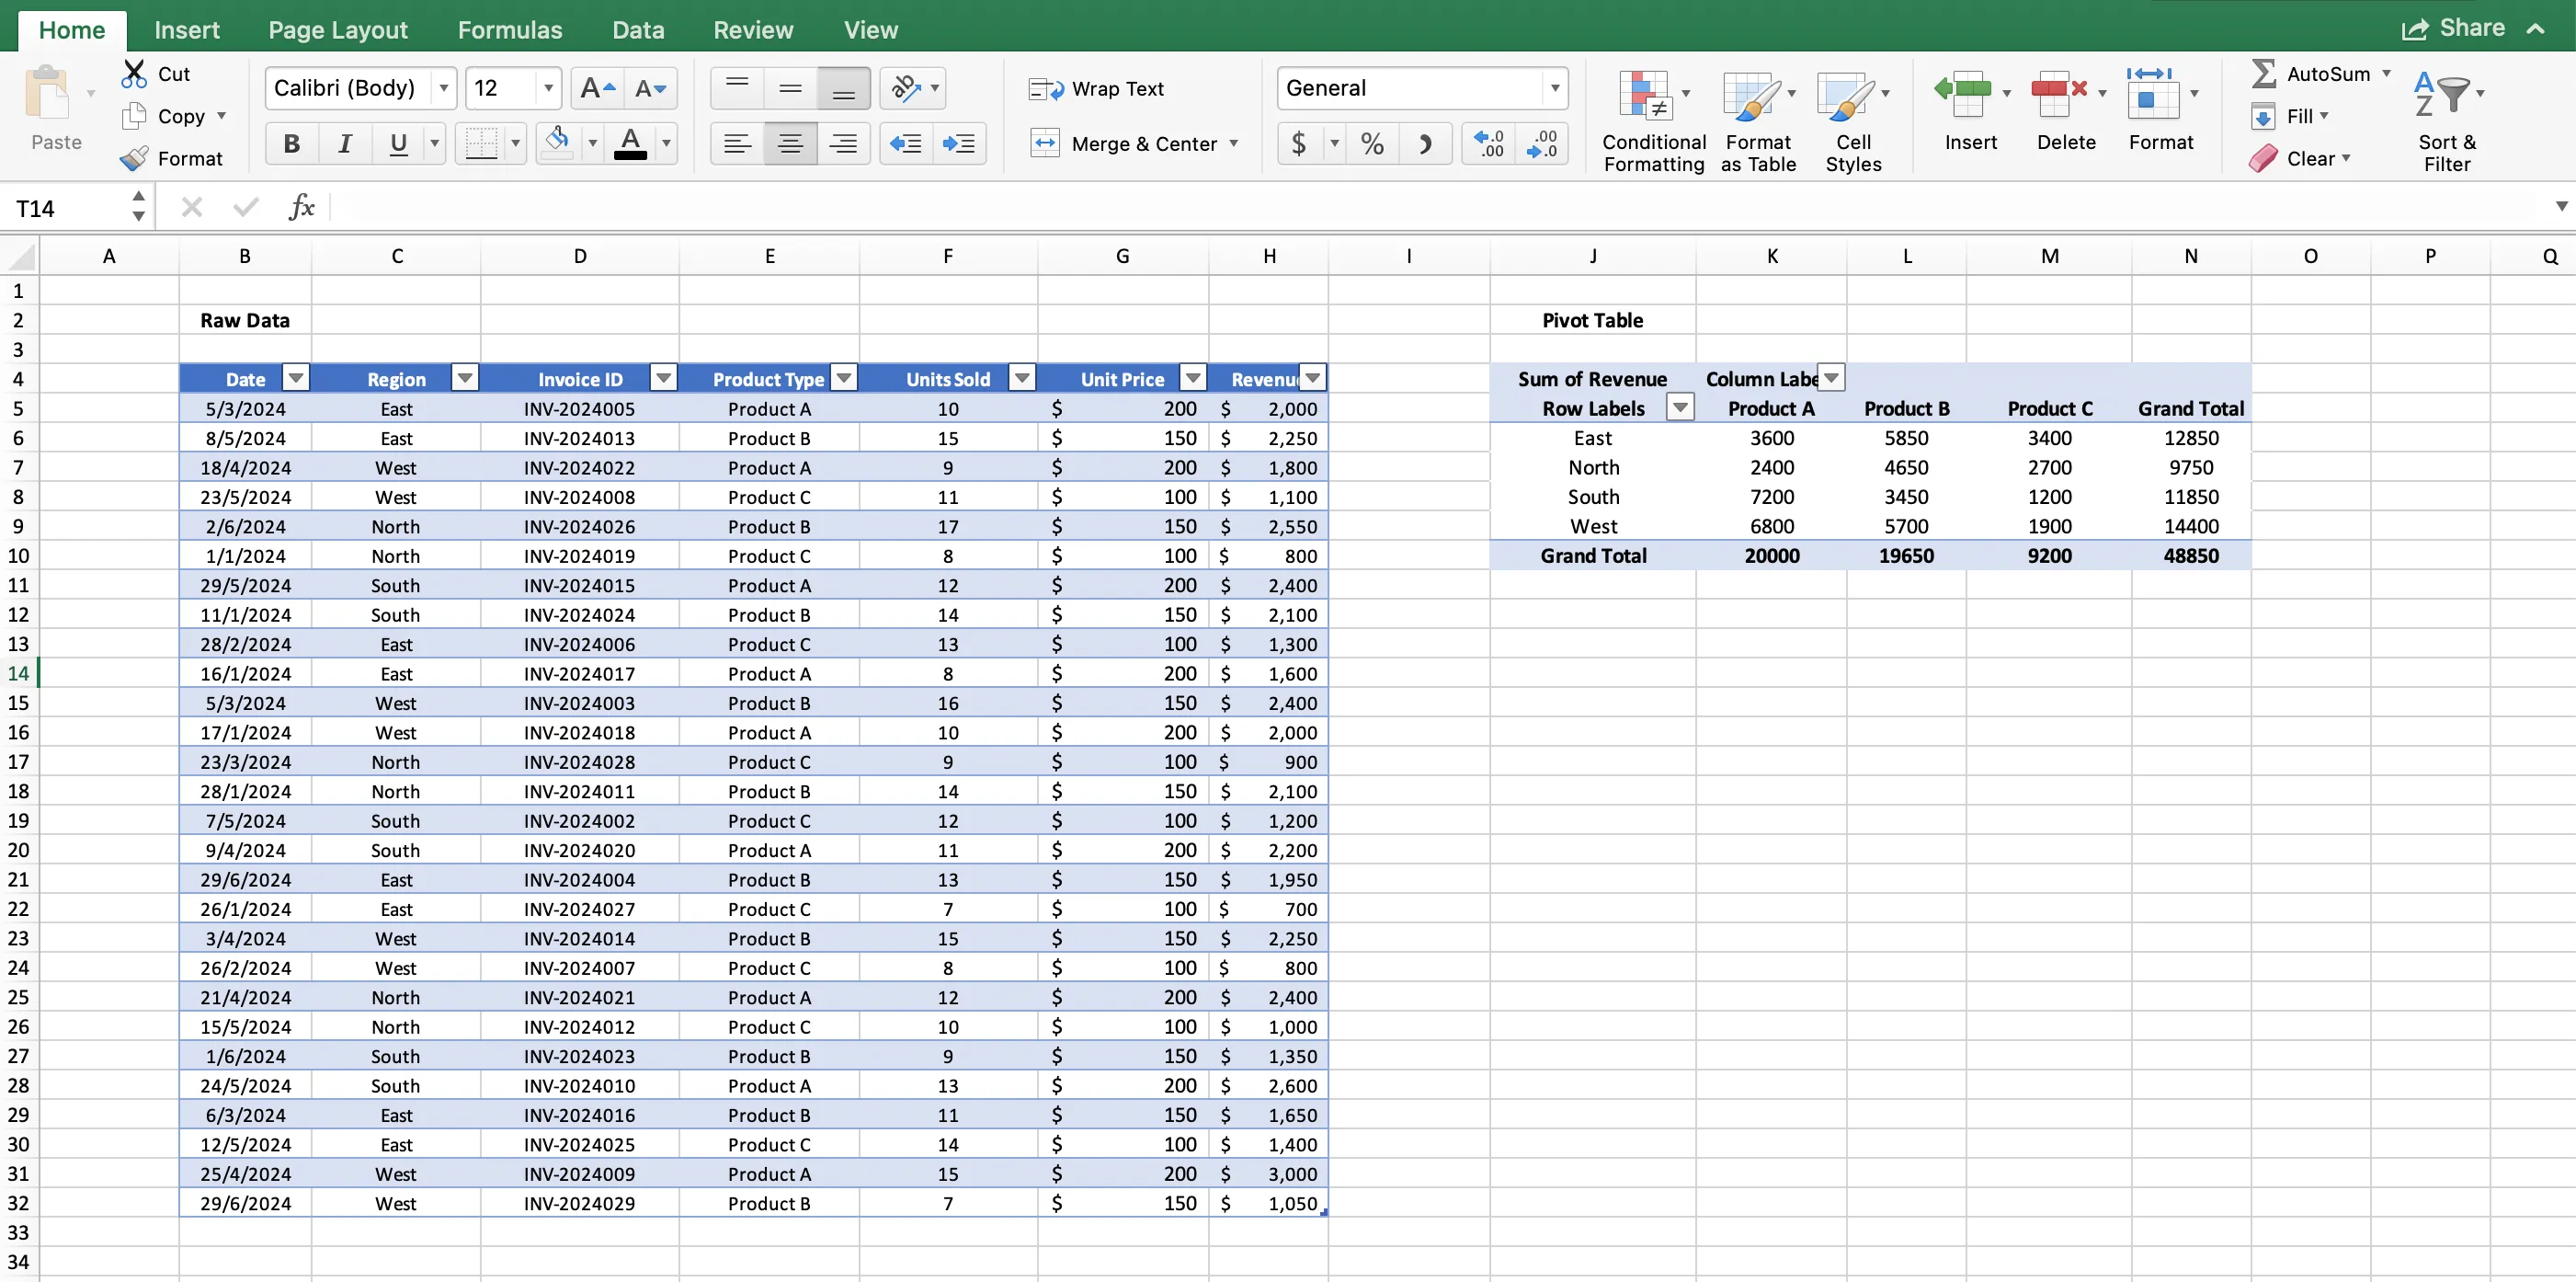
This pivot table transforms your complex dataset into an easy-to-understand summary, enabling you to make informed decisions about product strategies and regional sales focuses. In essence, they turn extensive and complex spreadsheets into clear, concise, and actionable insights.
Streamlining Data Analysis with Filters in Excel
Filters in Excel are a crucial tool for managing large datasets, especially in a business context where data can be extensive and varied. When you're dealing with thousands of rows of data, it's not always necessary or efficient to view everything at once. This is where the power of filters comes into play, allowing you to focus on specific segments of your data that meet certain criteria.
Filters in Excel let you focus on specific data segments, displaying only the rows that are relevant to your current analysis needs – offering an alternative method to pivot tables to segment your data. This functionality can prove incredibly useful in various business scenarios, such as:
- Simplifying Data Review: Filters make it easier to review and analyse data subsets without getting overwhelmed by the full dataset.
- Enhancing Reporting and Decision Making: By filtering data, you can create more targeted reports, leading to more informed business decisions.
- Sales Analysis: Filter sales data by product, region, or salesperson to identify top performers or areas needing improvement.
- Customer Segmentation: Use filters to segment customers based on demographics, purchase history, or engagement levels.
- Financial Data Review: Filter financial statements to focus on specific accounts, periods, or categories.
How to Use Filters in Excel?
To add a filter in Excel, you simply go to the 'Data' tab and select 'Filter'. This action adds a dropdown arrow to each column header in your dataset. Clicking on these arrows opens a range of options:
- Sort Data: You can quickly sort your data in ascending or descending order based on the contents of the column.
- Select Specific Data: Choose which rows you want to display. For example, if you're analysing customer data, you might filter to show only orders (rows) from specific customers or where the order totals are above a certain amount or in a certain percentile of the data (e.g top 10% of orders).

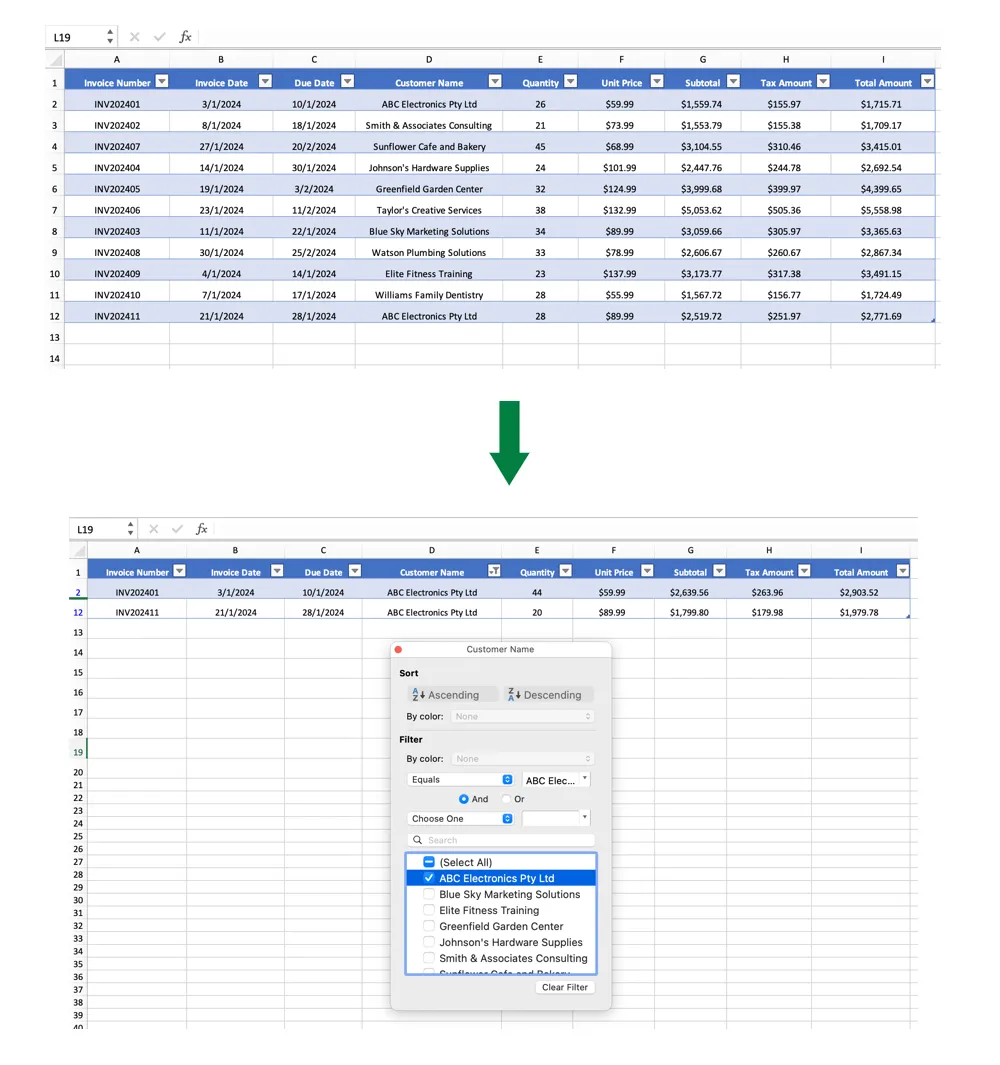
Practical Example: Filtering Data in a Business Context
Let's say you have a dataset of transactions, and you're interested in analysing purchases by a certain customer. By applying a filter to the customer name column, you can select to view only the transactions belonging to that specific customer. This filtered view allows you to focus on the most relevant data for your analysis, making it easier to draw insights and conclusions.
Or, say you're managing inventory, you can filter your product list to show only items that are below a certain stock level, enabling you to quickly identify which products need to be reordered.
Ultimately, filters are an essential feature in Excel for anyone in the business sector who needs to manage and analyse large datasets. They provide a straightforward way to narrow down your data to the most relevant subsets, enhancing your ability to make data-driven decisions efficiently.
Accelerating Tasks with Excel Keyboard Shortcuts
For small business owners who frequently use Excel for creating reports and managing data, efficiency is key. One way to enhance productivity in Excel is by mastering keyboard shortcuts. These shortcuts allow you to navigate, format, and manipulate your spreadsheets much faster than using the mouse alone. Here are some essential Excel keyboard shortcuts that can save you time:
- Creating a New Workbook: Quickly start a new project with Ctrl-N (PC) or Command-N (Mac).
- Selecting Entire Rows and Columns: Easily select an entire row using Shift-Space or an entire column with Ctrl-Space (PC) or Control-Space (Mac). This is particularly useful when applying formats or formulas to whole rows or columns.
- Selecting Rest of Column/Row: To extend your selection to the rest of a column, use Ctrl-Shift-Down/Up (PC) or Command-Shift-Down/Up (Mac). For rows, use Ctrl-Shift-Right/Left (PC) or Command-Shift-Right/Left (Mac). This shortcut is handy for quickly highlighting all the data in a row or column.
- Adding Hyperlinks: Insert hyperlinks in your data with Ctrl-K (PC) or Command-K (Mac), which can be useful for linking to related documents or web pages.
- Opening the Format Cells Window: Access formatting options with Ctrl-1 (PC) or Command-1 (Mac), allowing you to change number formats, alignments, and more.
- Auto-summing Cells: Sum selected cells instantly using Alt-= (PC) or Command-Shift-T (Mac), a great time-saver for quick calculations.
As you become more familiar with these shortcuts, you'll find that your efficiency in using Excel for data management tasks improves, making the process of report creation and data analysis much smoother and quicker - leaving more time to focus on other critical aspects of your business.
Cleaning Your Data with Duplicate Removal
When working with extensive data sets in a business environment, encountering duplicates is almost inevitable. These repetitions, while seemingly harmless, can distort data analysis, leading to skewed results. Excel's 'Remove Duplicates' feature is a handy tool for cleaning up your data, ensuring that each data point is unique and accurate.
In a typical business scenario, you might have a comprehensive list of transactions or client interactions. Over time, this list can accumulate duplicate entries, making it difficult to accurately assess client engagement or transaction frequency. This is where Excel's capability to remove duplicates becomes invaluable.
To utilise this feature, first select the column or row from which you want to remove duplicates. Then, navigate to the 'Data' tab and click on 'Remove Duplicates'. In older versions of Excel, you'll find this under the 'Tools' section. A dialog box will appear, asking you to confirm the columns you want to deduplicate. Once you click 'Remove Duplicates', Excel will eliminate any repeated entries, leaving you with a dataset that accurately represents each unique item or interaction.
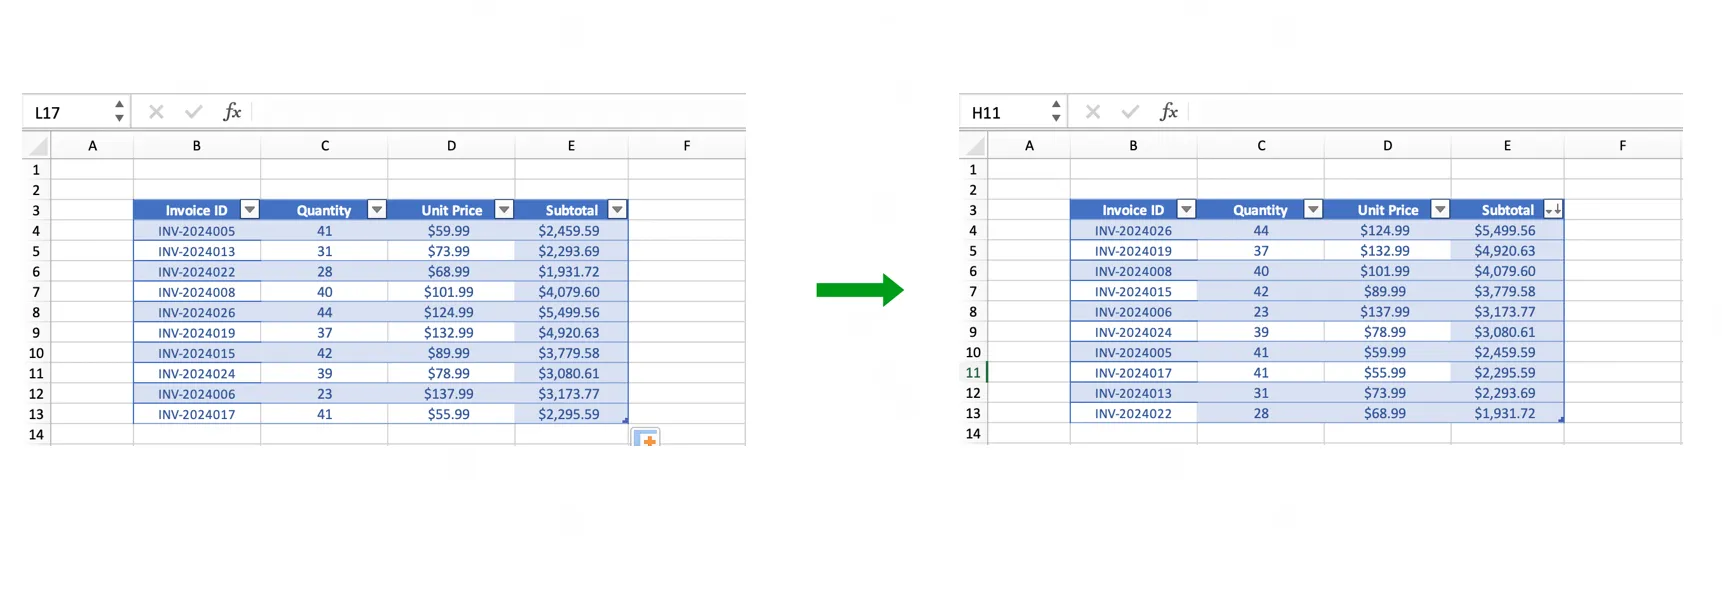
Practical Example: Streamlining a Customer Database
Imagine you're managing a client database in Excel, and you have multiple entries for some clients due to repeated interactions; you can remove these duplicates to get a true count of unique clients. By selecting the entire dataset and then removing duplicates based on a column that is a unique identifier like an email address, you can ensure that each client is only represented once in your list, making it easier to manage communication and analyse customer data.
This feature is particularly useful in various business applications, such as refining customer databases, ensuring accurate financial records, and maintaining up-to-date inventory lists. By regularly cleaning your data to remove duplicates, you can make more informed decisions based on precise and reliable data.
Mastering Conditional Formatting in Excel for Enhanced Data Analysis
Conditional formatting in Excel is a dynamic feature that enhances your data analysis by automatically changing the colour of cells based on their contents – helping you to quickly identify key data points, trends, and anomalies in a spreadsheet.
Whether it's finding common patterns across rows or identifying numbers that exceed a certain threshold, like sales figures that exceed targets or flagging overdue project tasks, conditional formatting helps you visualise data trends and outliers with ease - turning a standard spreadsheet into a dynamic, easy-to-read visual tool.
How Does Conditional Formatting Work?
To apply conditional formatting, start by selecting the cells you want to analyse. Then, navigate to the 'Home' tab and click on 'Conditional Formatting'. Here, you'll find a variety of options to choose from, such as highlighting cells that contain values above or below a certain number, or even those that rank in the top 10% of your data. Excel also allows for custom rules, giving you the flexibility to tailor the formatting to your specific needs.
Once you've selected your desired rule, a dialogue box will appear where you can fine-tune the specifics of your formatting criteria. After setting it up, click 'OK', and you'll immediately see the changes reflected in your spreadsheet.
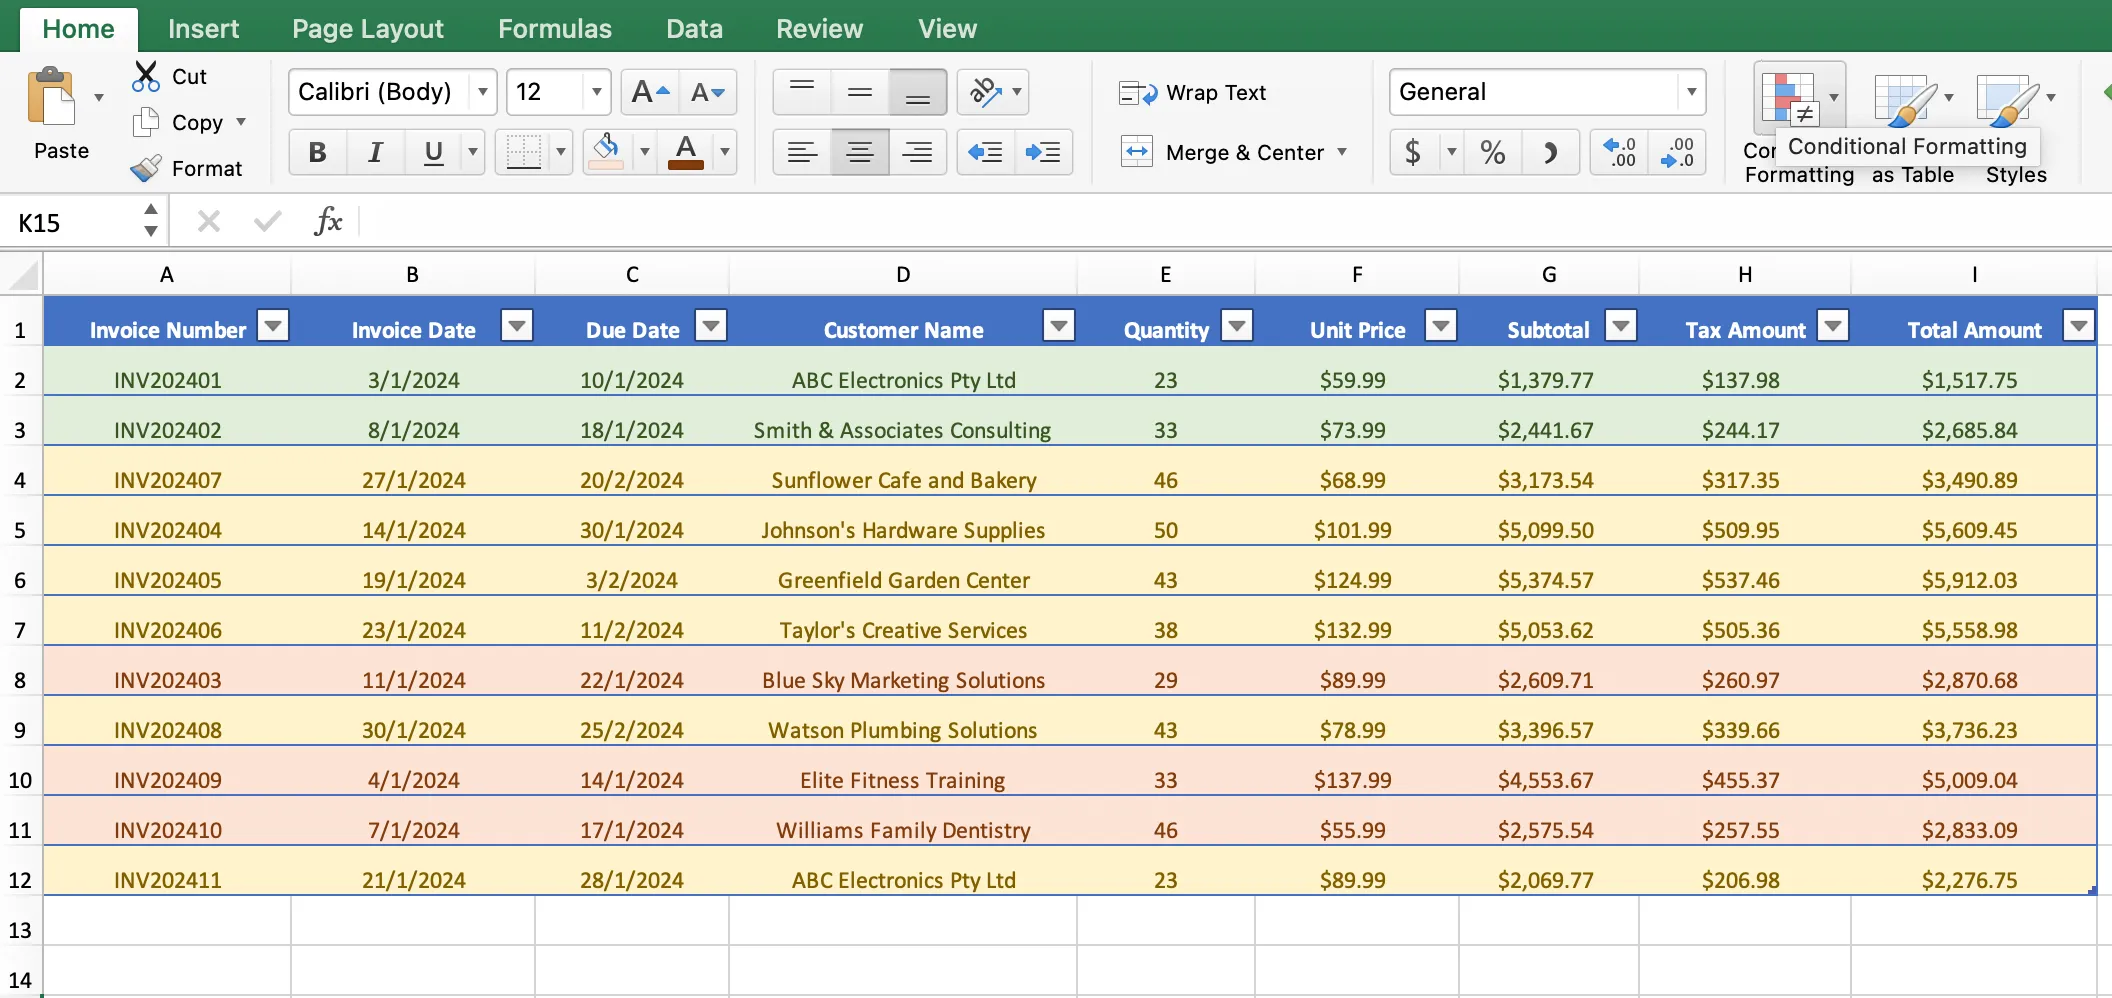
Practical Example: Tracking Invoice Payment Status
As a small business owner, managing cash flow is vital. Consider you have a spreadsheet of issued invoices with due dates and payment statuses. You can use conditional formatting to highlight overdue invoices. For example, you could set a rule to turn the cell colour to orange if the due date is past and the invoice status is still 'unpaid'. This method helps you quickly identify overdue payments, enabling you to follow up promptly and manage your cash flow more effectively.
Similarly, you could apply a different colour, such as green, to indicate invoices that have been paid on time, distinguishing between paid and unpaid invoices at a glance while also providing a clear visual representation of your overall payment collection efficiency.
Over time, this system can assist you in identifying patterns in payment behaviours, allowing for better forecasting of cash flow and more strategic planning in your financial management.
Alternatively, for small business owners looking for a more integrated solution, Thriday's instant invoicing suite offers a streamlined approach. With Thriday, you can manage invoices and payments directly within the platform, reducing the need for manual tracking in spreadsheets. Its automated system not only sends out invoices but also tracks their status in real-time, alerting you the moment an invoice is paid or becomes overdue. This feature simplifies cash flow management, saving valuable time and effort that can be redirected towards growing your business.

Closing: Leveraging Software to Streamline Your Business Operations
Whether you're managing financial records, tracking inventory, or analysing sales data, Excel offers a wealth of features that can enhance your business efficiency and decision-making capabilities. Not just for accountants or data analysts; Excel stands as a trusty and versatile tool that can play a crucial role in automating and streamlining processes across your business.
In this guide, we've covered the basics as well as explored some more advanced tips and tricks to help you unlock the program's potential in automating tasks, analysing data, and creating comprehensive reports to elevate your business operations – setting you on a slow but sure path to Excel wizardry!
However, for small business owners seeking an even more streamlined approach, Thriday represents a significant leap forward in business finance technology, offering a comprehensive, automated alternative to manual Excel processes.
The Thriday Advantage: Revolutionising Small Business Finance
Seamlessly integrating banking* and automated accounting into a single, user-friendly interface, Thriday is an all-in-one financial management platform that harnesses the power of AI to simplify financial management and automate tasks that typically require manual input and management in Excel.
With Thriday, you can effortlessly manage your finances whilst also gaining comprehensive real-time insights into your business's financial health - empowering you to take your data-driven business decision-making to the next level and unlocking new opportunities for continued business success.

From automatically generated financial reporting to future cash flow and tax forecasting, Thriday handles all of the key processes to eliminate financial admin and free up valuable time for small business owners, helping you to focus more on what you do best – running your business.
Join the Thriday revolution to enjoy a seamless financial management experience, take control of your business finances and reclaim your time today!
DISCLAIMER: Team Thrive Pty Ltd ABN 15 637 676 496 (Thriday) is an authorised representative (No.1297601) of Regional Australia Bank ABN 21 087 650 360 AFSL 241167 (Regional Australia Bank). Regional Australia Bank is the issuer of the transaction account and debit card available through Thriday. Any information provided by Thriday is general in nature and does not take into account your personal situation. You should consider whether Thriday is appropriate for you. Team Thrive No 2 Pty Ltd ABN 26 677 263 606 (Thriday Accounting) is a Registered Tax Agent (No.26262416).


.svg)


![[FINAL] How to Use Excel for Small Business | Functions, Tips & Tricks](https://cdn.prod.website-files.com/61dd1b15c9c40d517f9a423b/64938e968eced43c99651d14_63c74512c7ba4a21181a463f_nikita-fernandes-275x275.avif)


.webp)